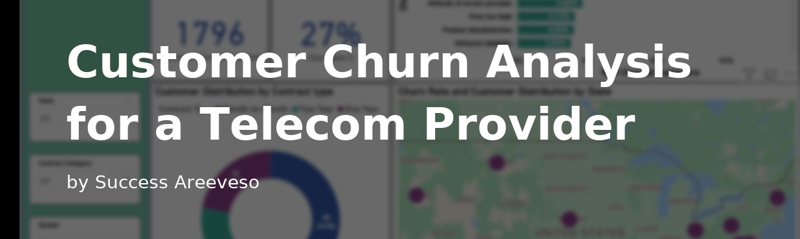
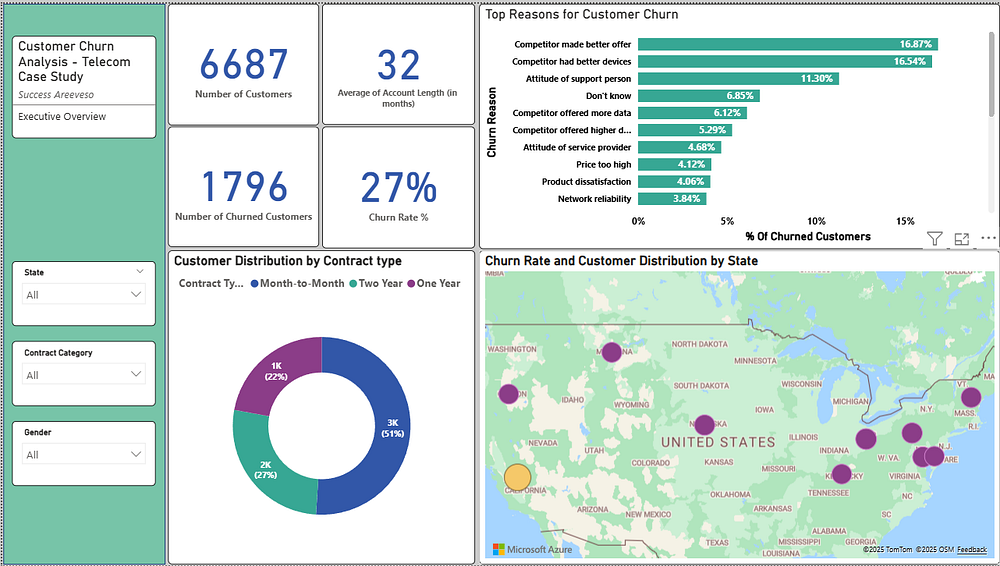
A telecom provider serving 6,687 customers recorded 1,796 churned users, representing a churn rate of approximately 27%. The challenge was to identify why customers were leaving, who was most at risk, and to propose data-driven interventions that could improve retention and lifetime value.
Methodology
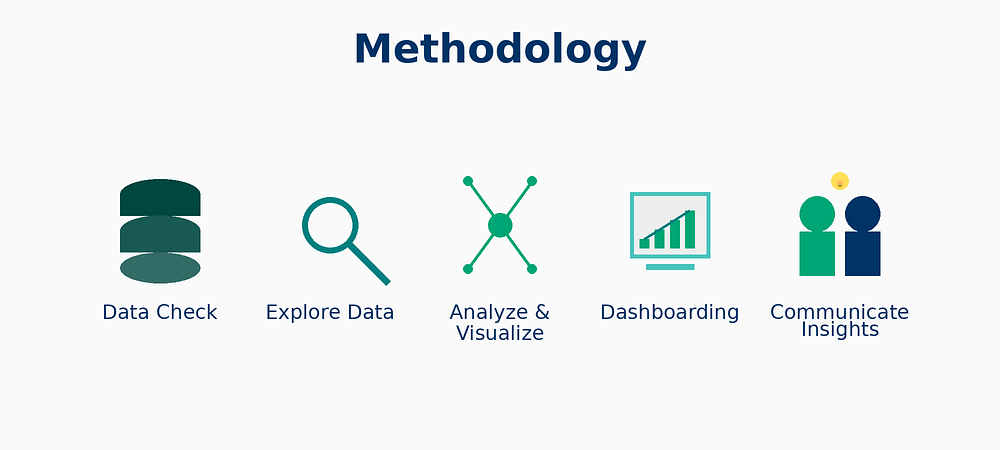
The data was cleaned and modelled in Power BI, where a series of DAX measures were used to calculate churn rate and behaviour-based KPIs. Interactive dashboards were developed to explore churn across five analytical dimensions:
Executive Overview, Churn Drivers, Customer Demographics, Usage Behaviour and Extra Charges, and Customer Service Experience.
Churn Drivers
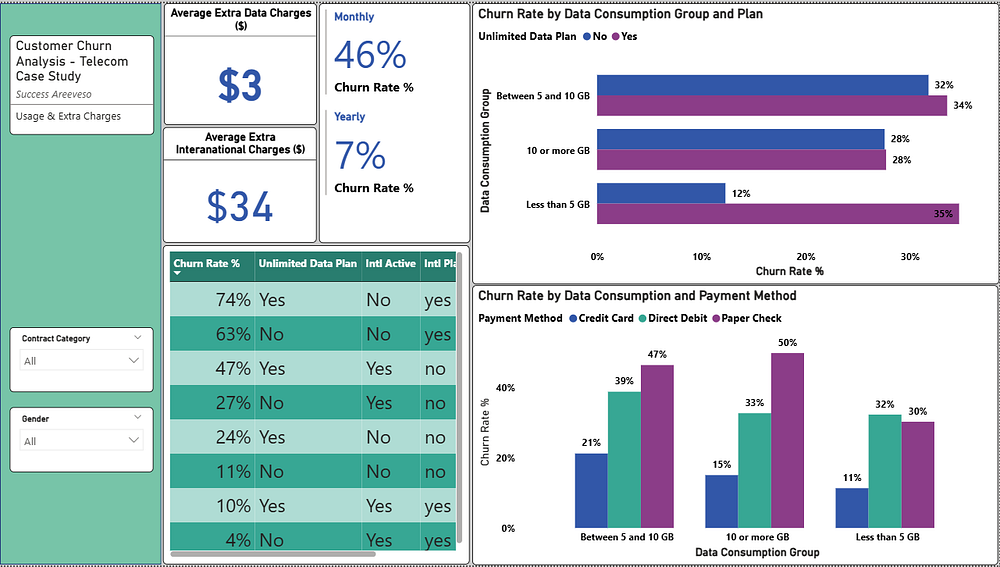
Competition is the top churn driver. In the survey, 45% of churned users cited better offers from competitors, 16% complained about pricing, and another 11% pointed to poor service.
The average account length in months was 32, and the top three reasons customers left were because
- A competitor made a better offer (16.87%),
- Competitor had better devices (16.54%),
- and the attitude of the support person (11.30%)
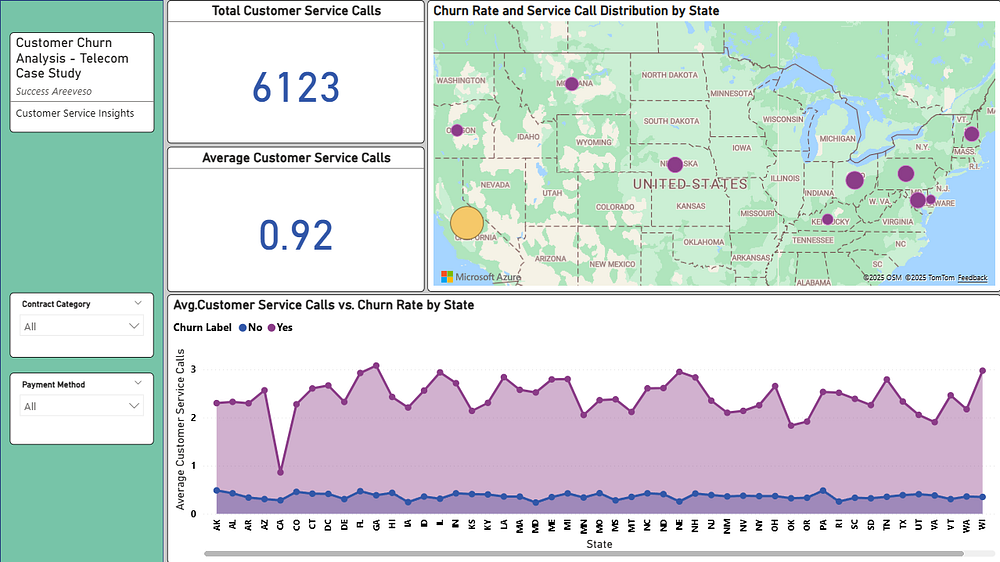
California has the highest churn rate at 63.24%
Demographics
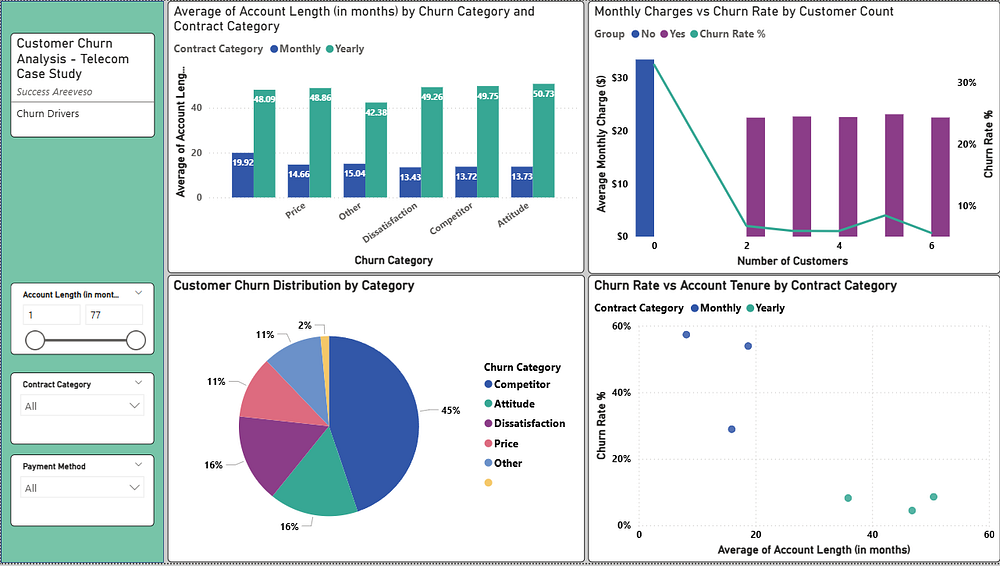
Churn varied notably by age and customer segment:
- Seniors: 38% churn rate
- Under-30 group: 25% churn rate
- Other segments: 23% average
Additionally, customers paying by paper cheque or direct debit churn at higher rates than those paying by credit card. The data highlights that digital adoption and customer engagement are crucial levers for retention. Seniors and low-tech users require tailored outreach and simplified experiences. In comparison, the difference in gender between the monthly, yearly, and unlimited plans is not very significant. Furthermore, the highest churn rate by age group is in the 80+ age group, at 52%.
Usage & Extra Charges
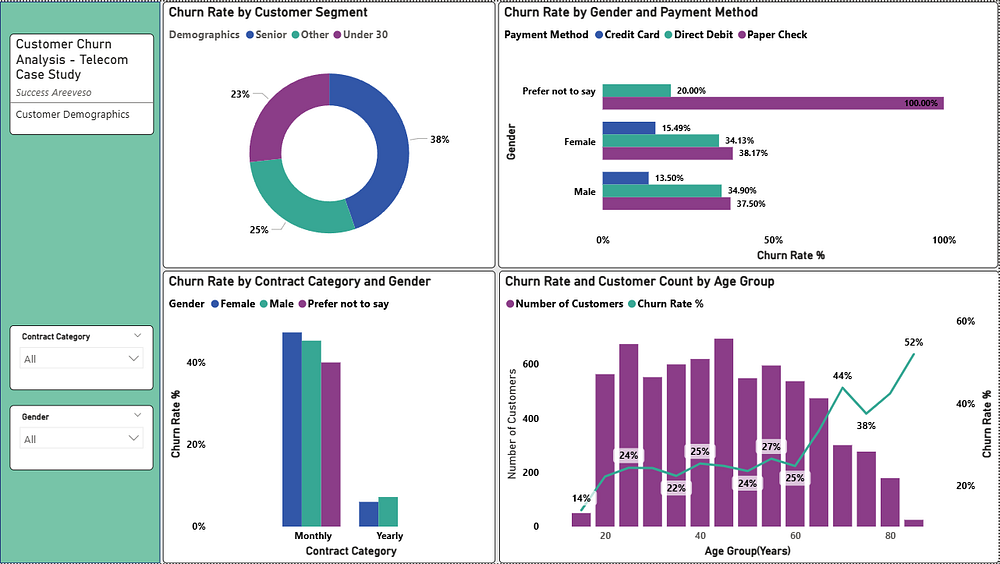
- Customers on month-to-month contracts accounted for 46% of all churn, compared with only 7% for annual contracts.
- The churn rate based on data consumption plans was shown: For <5 GB, 12% churn without unlimited plans, compared to 35% with unlimited plans, a 23 percentage point difference. For 5–10 GB, churn rates range from 32% to 34%, with little difference between unlimited and non-unlimited plans. For 10+ GB, churn stays at 28% regardless of unlimited status.
- Payment method effect: Credit Card has the lowest churn in every usage band; Direct Debit is higher, Paper Check is highest (e.g., at 10+ GB: 15% → 33% → 50%).
- Avg extra charges: $34 (international) and $3 (data).
Customer Service Experience
6,123 calls across the base (0.92 per customer, on average). Regions with the highest call frequency tend to exhibit higher churn — repeat contacts often signal unresolved issues.
RECOMMENDATION
- Promote Longer Contracts: Offer incentives, such as loyalty discounts, handset upgrades, or bundled services, to convert month-to-month users to one- or two-year agreements. Track the conversion rate from short to long contracts as a key metric. Reducing the share of month-to-month customers should correlate with lower overall churn.
- Flexible Data Plans for Heavy Users: Roll out mid-tier unlimited or high-cap plans that remove overage charges. Monitor churn rates across high-usage segments before and after the launch of the new plans to assess their impact. A 5–10% reduction in churn among this group would represent a meaningful revenue lift.
- Upgrade Customer Service: Measure first-call resolution and customer satisfaction scores. Provide frontline agents with enhanced training and increased authority to resolve billing and technical issues, thereby reducing the need for escalations. Reducing repeat calls should be tied directly to churn reduction targets.
- Segment-Focused Retention Campaigns:
- Seniors: Develop personalised outreach, simpler onboarding guides, and dedicated support channels. Track churn rate and engagement metrics within this segment after implementing these changes.
- Young & digital customers: Offer app-based loyalty rewards, refer-a-friend programmes, and data rollover options. Measure adoption and retention among under-30s.
- Real-Time Competitive Monitoring: Develop a competitive pricing dashboard that utilises web scraping or market intelligence feeds to identify when rival telecoms launch promotions. Tie this to internal alerting so marketing can proactively adjust offers. This helps maintain perceived value and reduces the 45% of customers leaving for better deals.